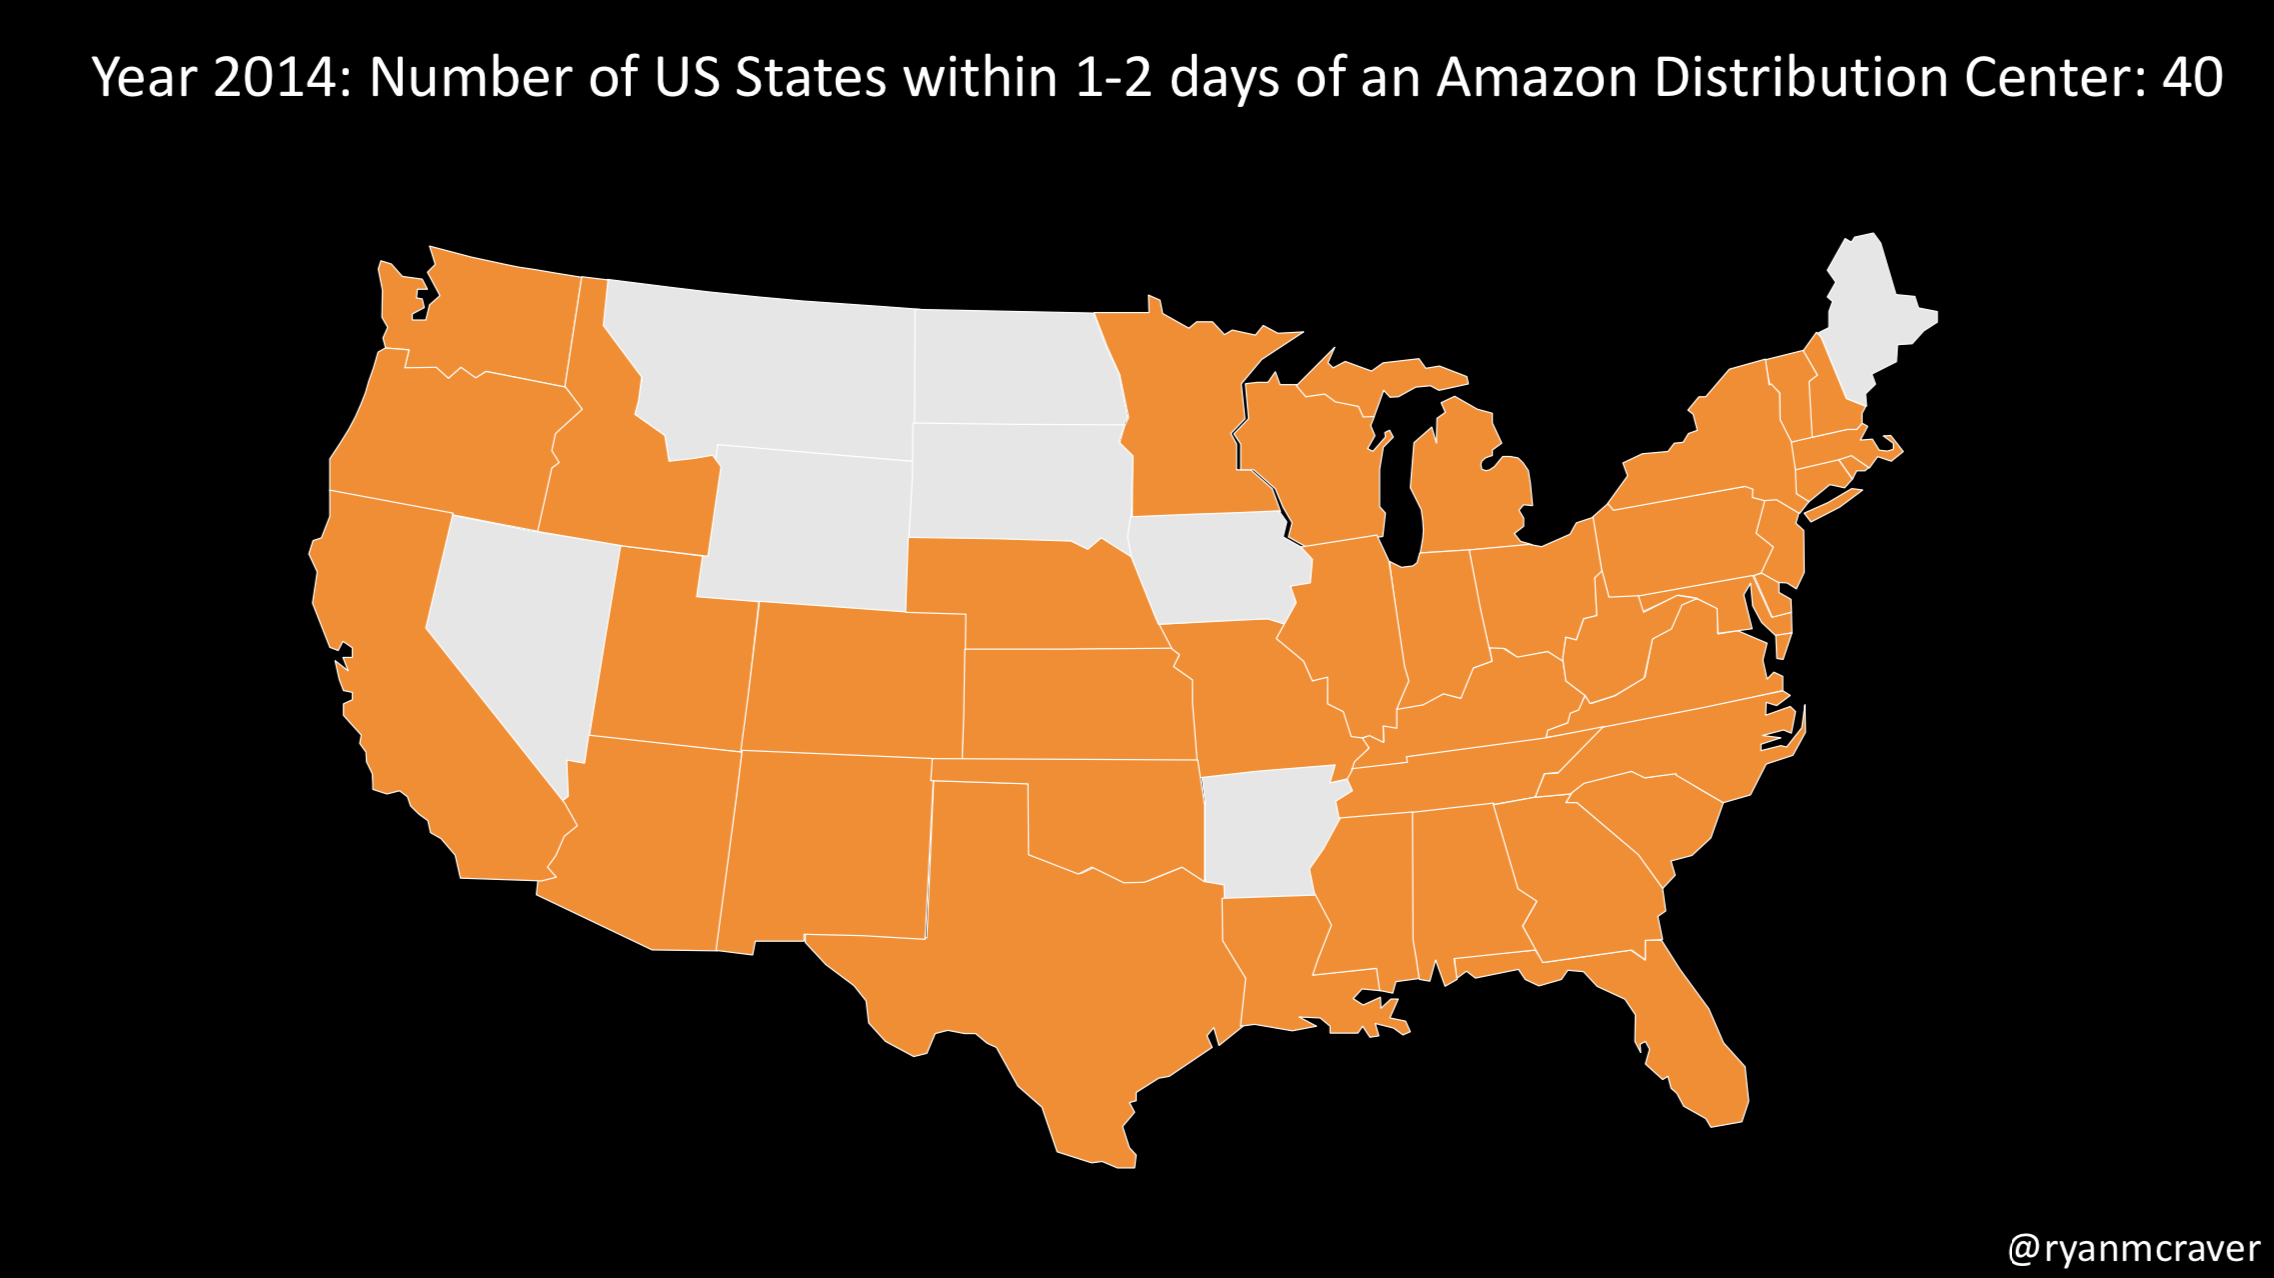
Amazon made quite a few waves about one day delivery. It’s been something Amazon has been capable of for nearly two years. Here is the evolution leading up to 48 states being within 1 day of delivery in 2017.


Amazon = The Service Provider
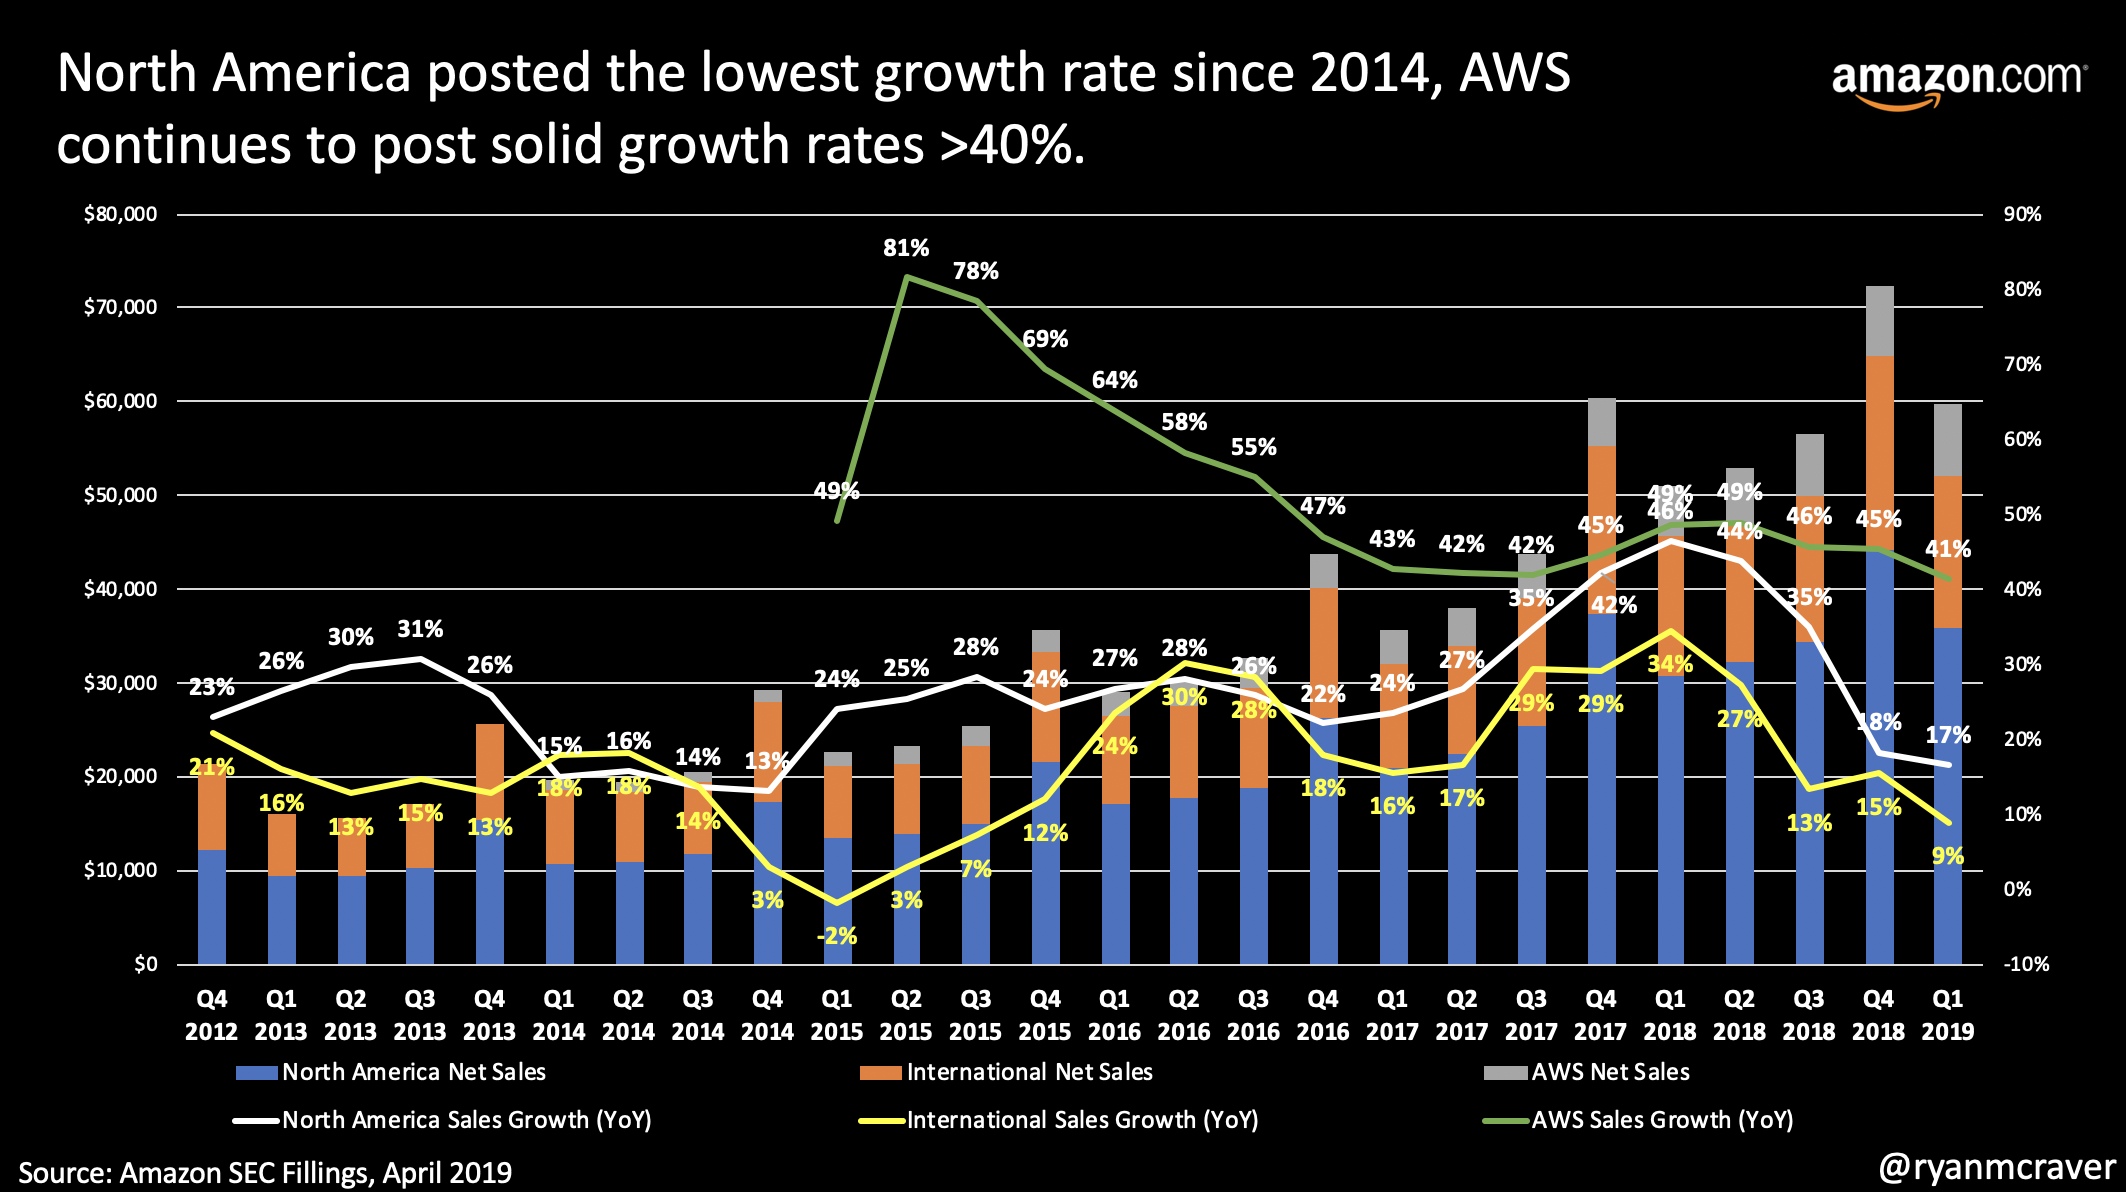
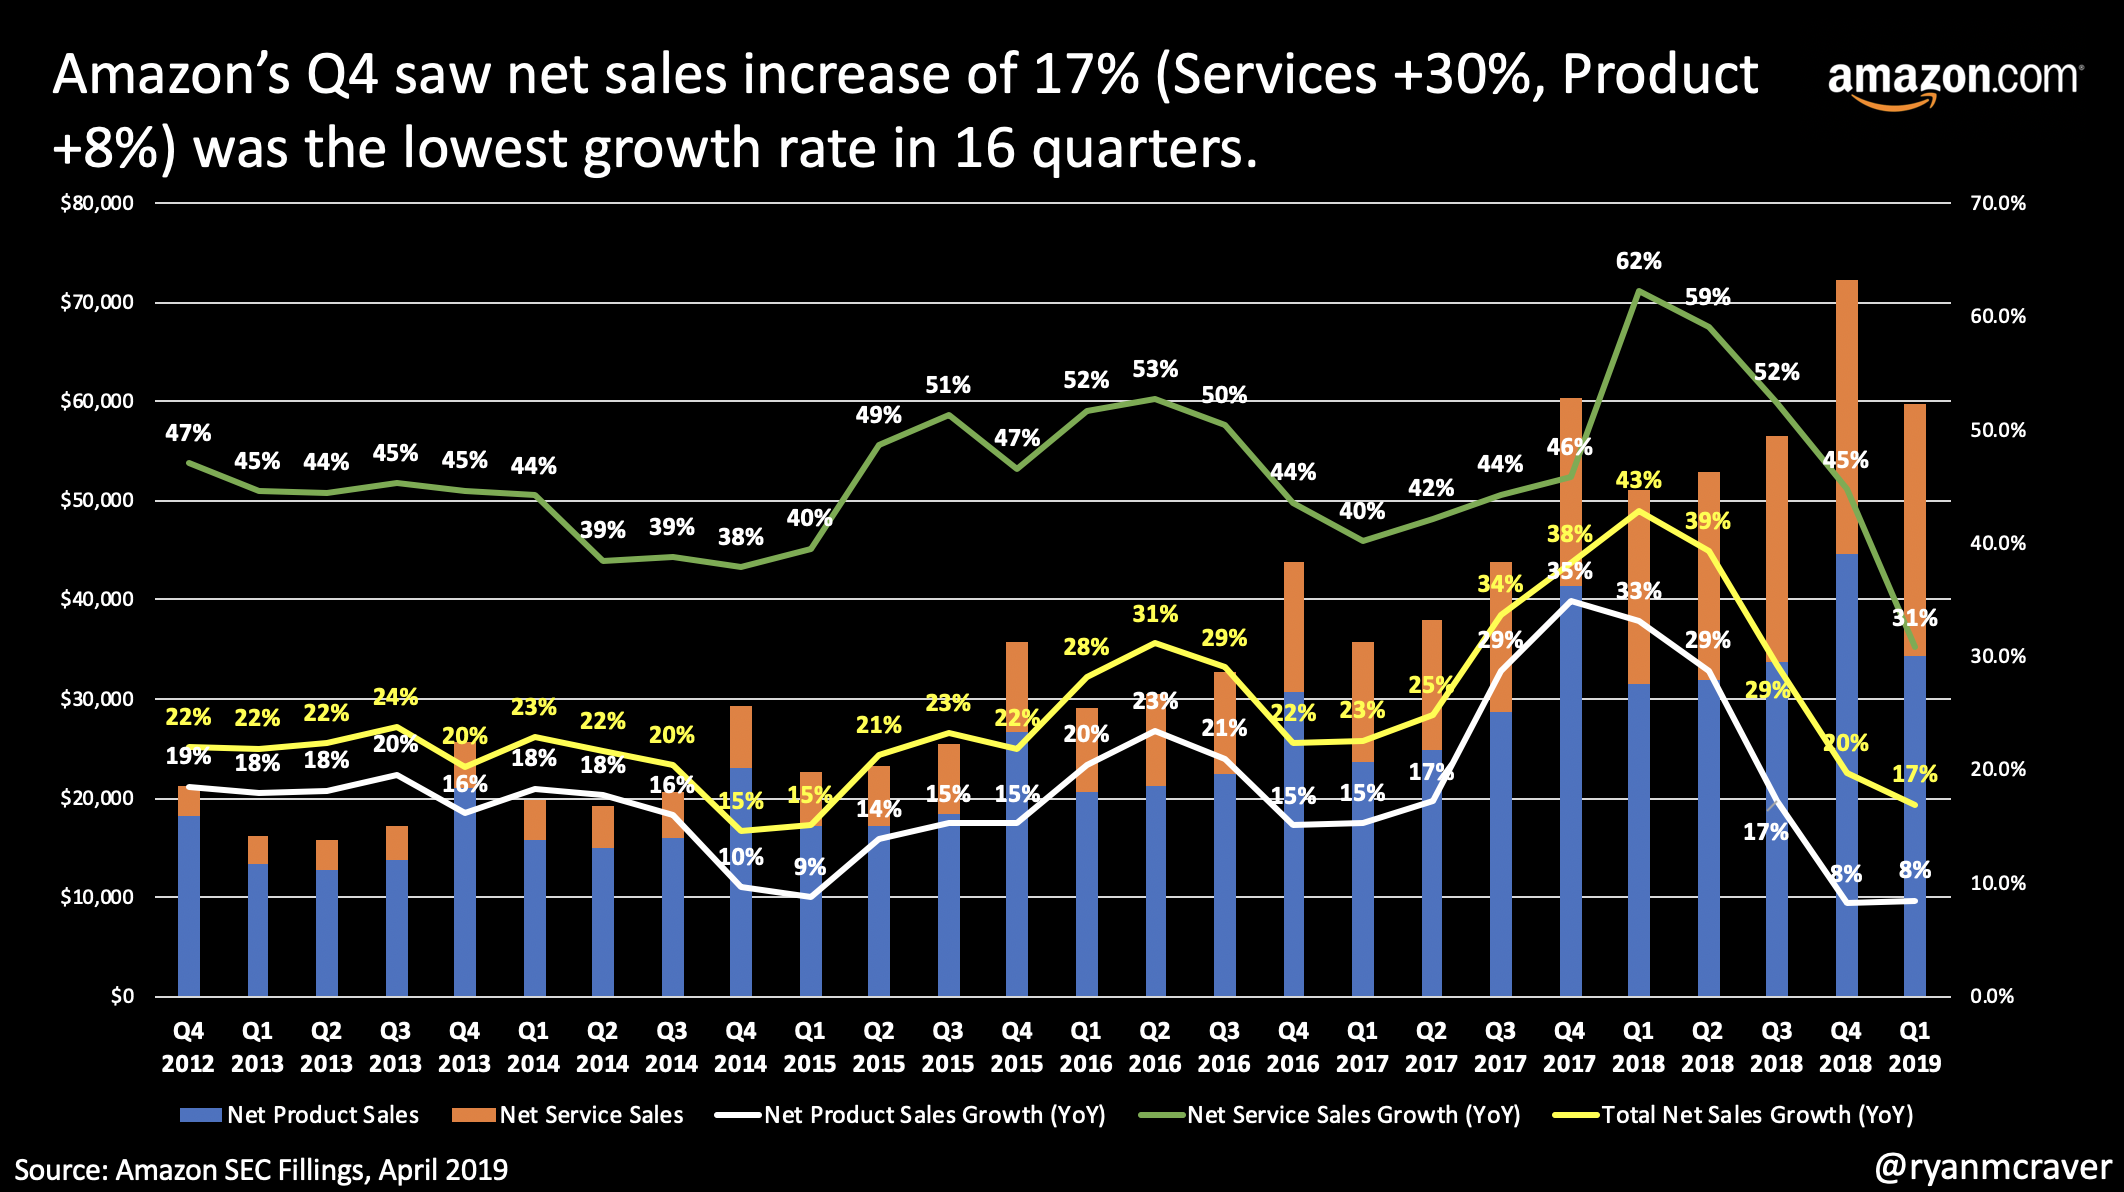
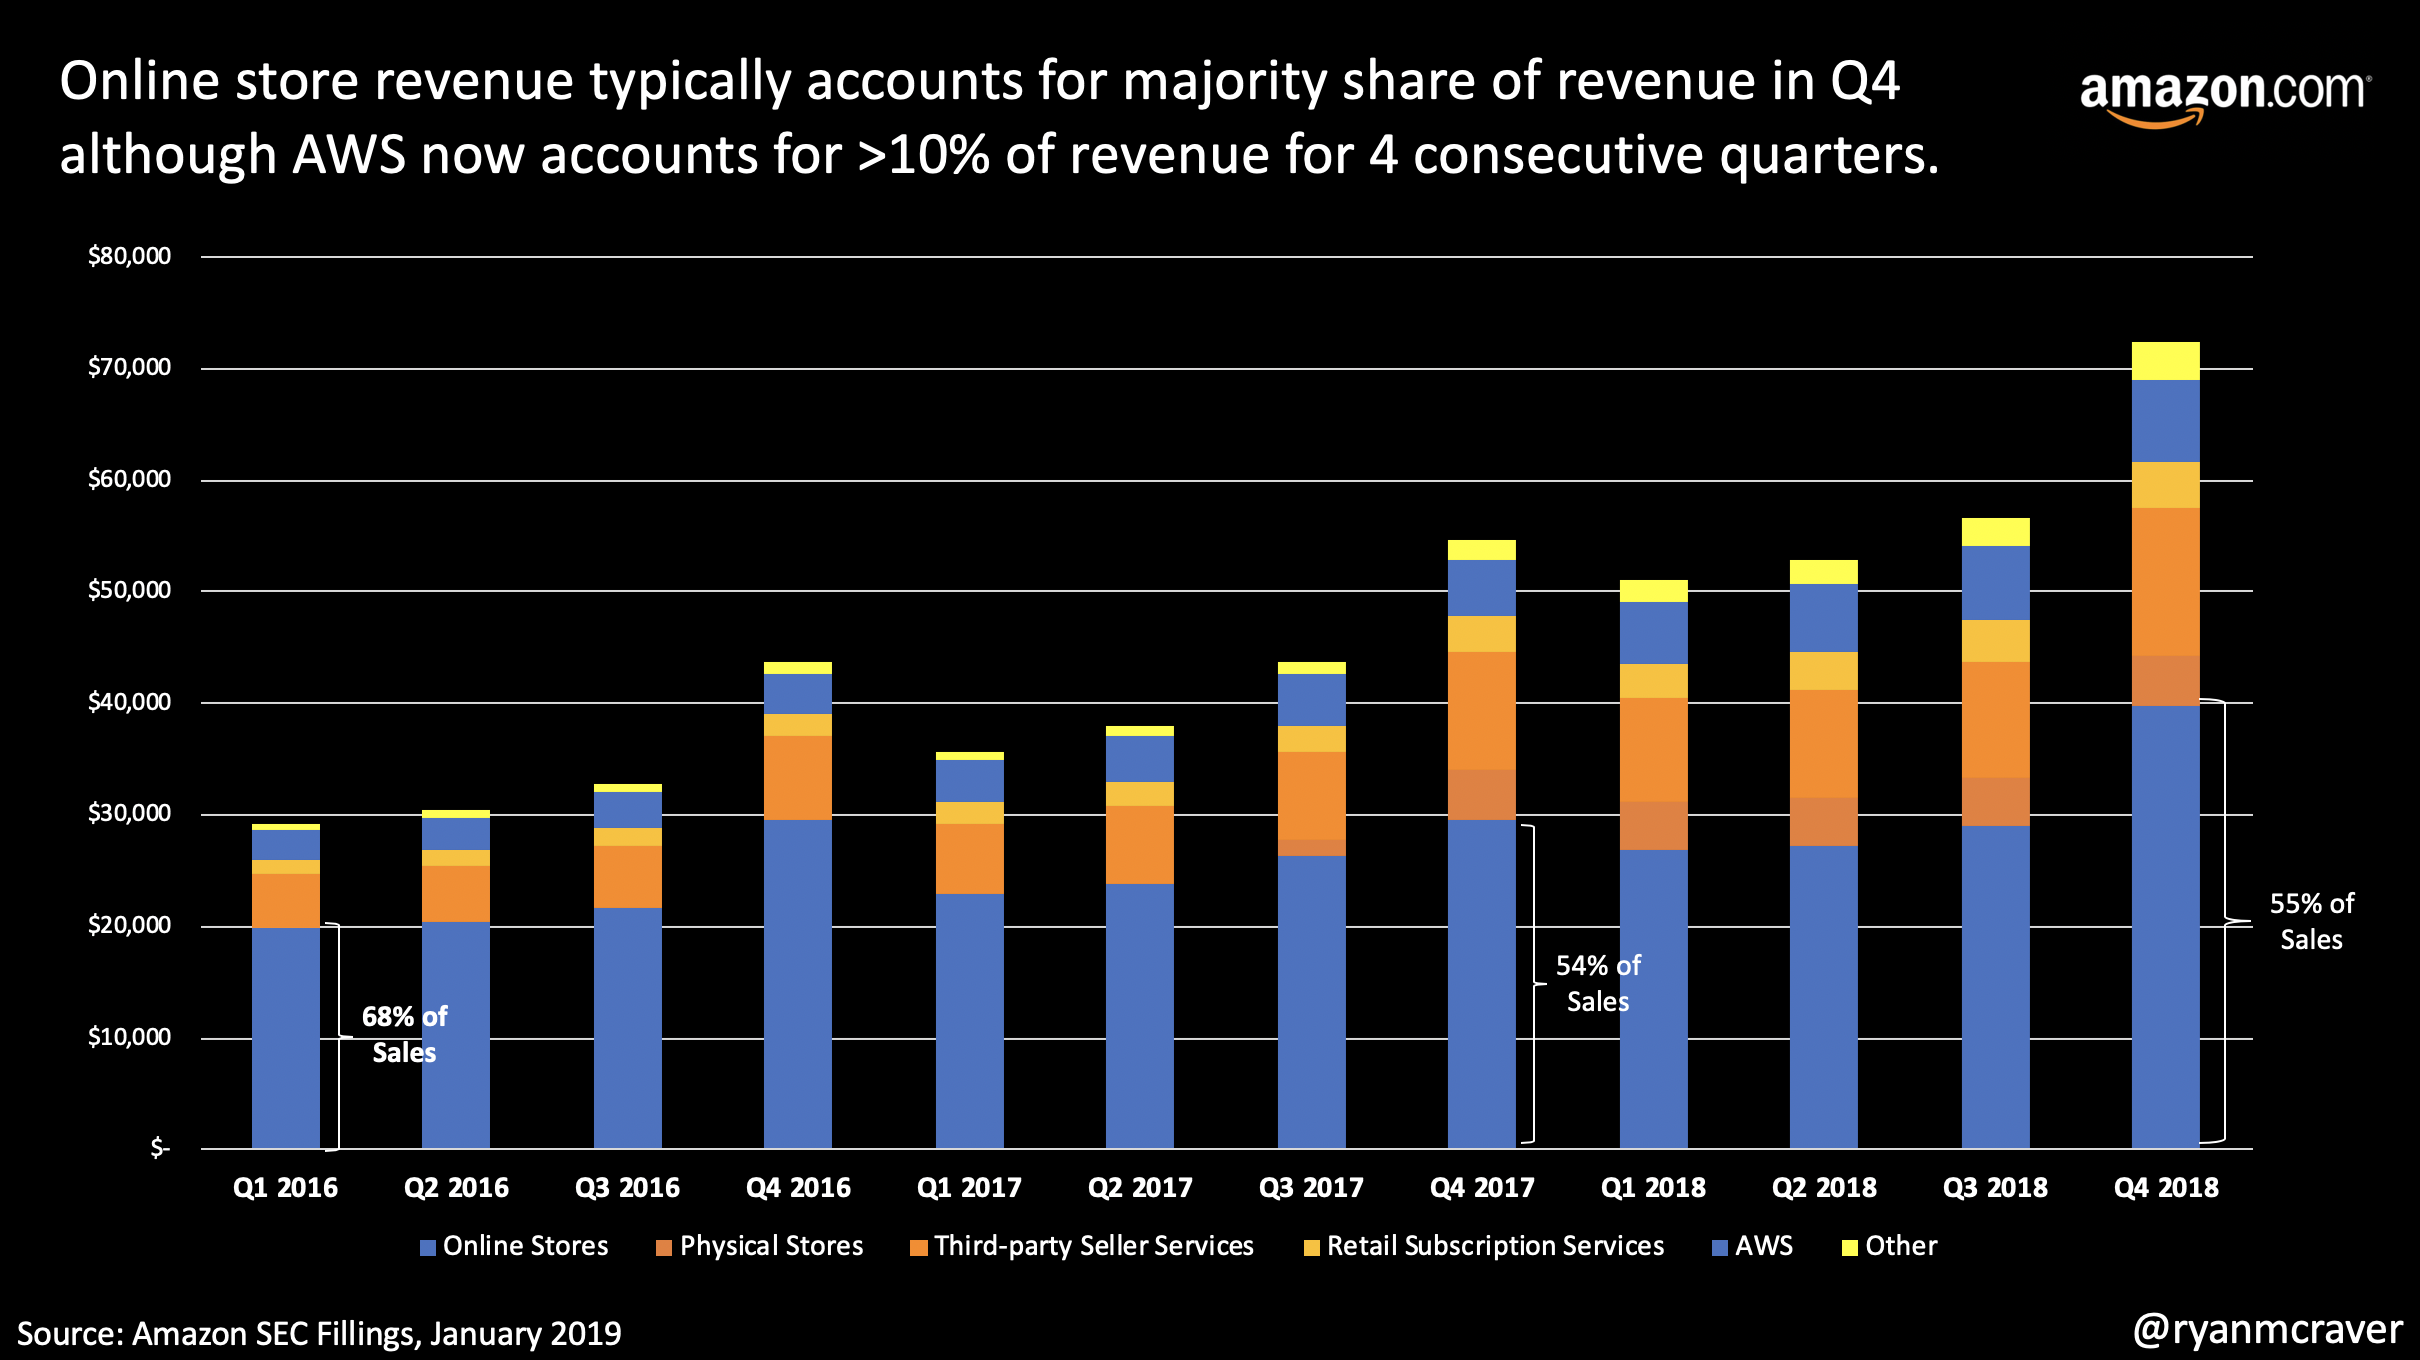
This was a well played and planned earnings release by Amazon. The January earnings release saw the slowest sales growth rate in 16 quarters which continued to slow even further in the recently quarter. The North America business hadn’t posted this small of an increase since 2014 and international since 2015. Whether due to the law of large numbers or the competition stepping up their game, one thing is certain. Amazon is becoming much more profitable as the company becomes less reliant on online owned sales.
So why was Amazon trading up post earnings? In the latest quarter, online accounted for less than 50% of the total revenue in the quarter. Third party revenue (seller services) accounted for 18% with the real growth coming from AWS and subscriptions at 13% (up from 10%) and 7% respectively (up from 5%). Services, services, services = profits, profits, profits. Yes, the p word that no one believes Amazon was capable of just 2 short years ago.
Despite some of the weakest revenue growth figures in years, Wall Street and Main Street still like what they heard and still believe in the Prime, AWS, Services shift.

Amazon's Quest to Become eBay and Alibaba
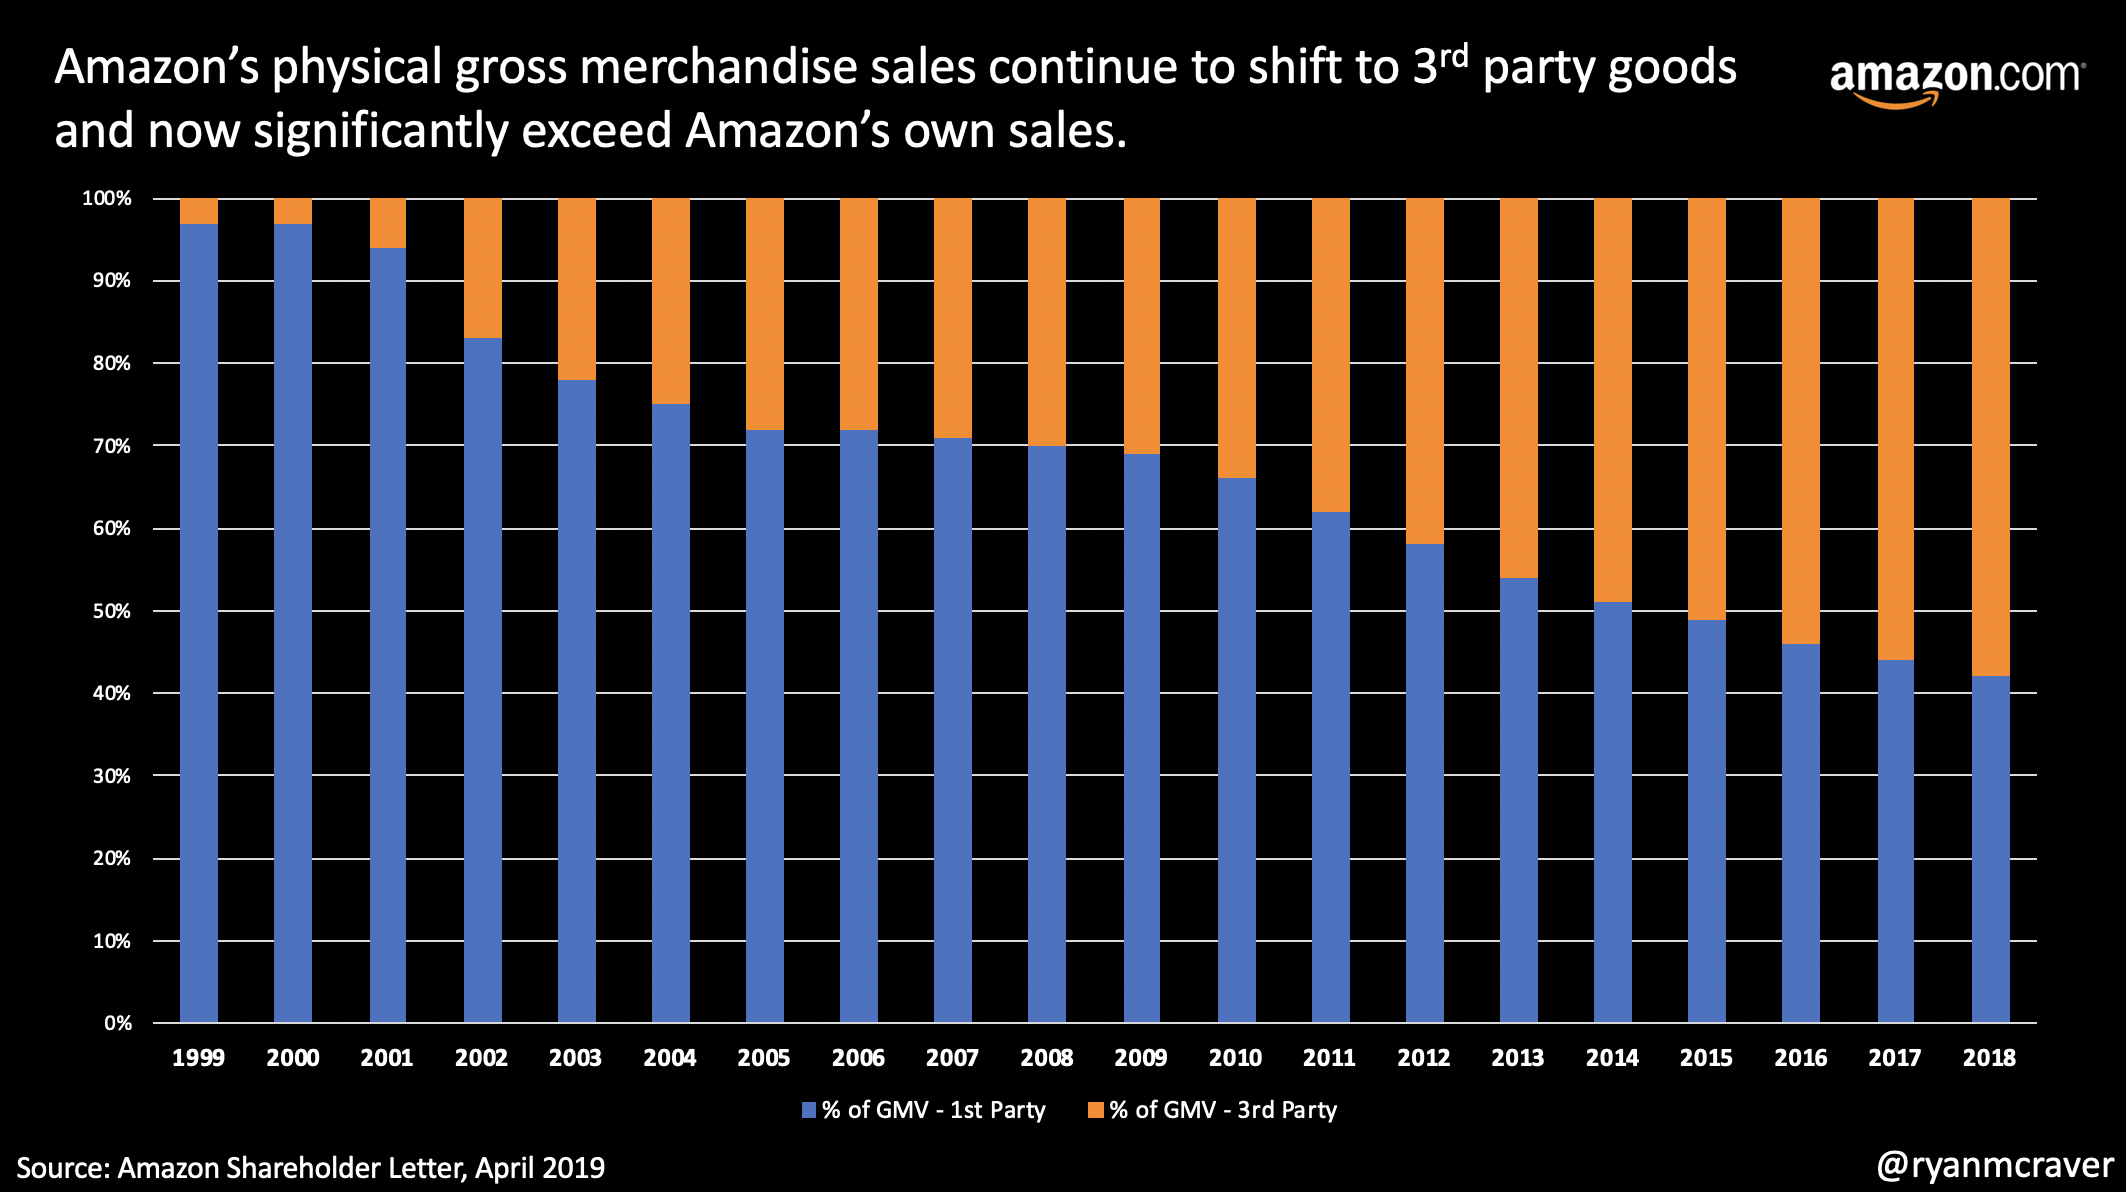
If anyone had any doubt that Amazon is sick of owning inventory and is more focused on selling services than Apple is, look no further than Jeff Bezos comments in today’s shareholder letter:
The percentages represent the share of physical gross merchandise sales sold on Amazon by independent third party sellers – mostly small- and medium-sized businesses – as opposed to Amazon retail’s own first party sales. Third-party sales have grown from 3% of the total to 58%. To put it bluntly: Third-party sellers are kicking our first party butt. Badly. And it’s a high bar too because our first-party business has grown dramatically over that period, from $1.6 billion in 1999 to $117 billion this past year. The compound annual growth rate for our first-party business in that time period is 25%. But in that same time, third-party sales have grown from $0.1 billion to $160 billion – a compound annual growth rate of 52%. To provide an external benchmark, eBay’s gross merchandise sales in that period have grown at a compound rate of 20%, from $2.8 billion to $95 billion. Why did independent sellers do so much better selling on Amazon than they did on eBay?
Although Jeff takes a swing at eBay, Amazon truly realizes the beauty of the inventory-less business models used by eBay and Alibaba. Lower cash requirements and better margins. When you chart out the growth, the growth is truly staggering:
Online Dating Monopoly
Mind boggling how cornered this market is by MatchGroup (tinder, PlentyofFish, match.com, okcupid), as online became the most popular way to meet:
Scooter Stats
Fascinating statistics and reporting on the economics of scooters from players like Lime and Bird. Not looking like the best of business models.
The average lifespan of a scooter was 28.8 days
The median lifespan was 26 days
The average vehicle went 163.2 miles over 92 trips during its lifetime
Five of the 129 initial-cohort scooters disappeared the same day they went into service (a lifespan of “0” days)
The scooter with the longest lifespan made it 112 days, last appearing in the data on Nov. 29
Only seven of 129 scooters lasted more than 60 days
Utilization
The average trip lasted 18 minutes
The average scooter did 3.49 rides per day
Revenue
Bird charges $1 to unlock a scooter and $0.15 per minute
At 18 minutes, the average trip generated $3.70 in revenue (note that this, based on three months of data in Louisville, is nearly identical to the $3.65 in revenue per ride Bird reportedly told investors it was averaging as of June)
At 3.49 rides per day, the average scooter generated $12.91 in revenue per day
General costs, based on reporting by The Information
Bird spent $1.72 per ride on charging costs
It spent another $0.51 per ride, on average, on repairs
Credit-card fees cost $0.41 per ride
Customer support adds $0.06 per ride
Insurance is $0.05 per ride
This adds up to $2.75 in what you could consider operating costs per ride
Louisville-specific costs, from the city’s dockless vehicle policy
A company pays $2,000 for a probationary license (required for the first six months of operation)
It pays an additional $1,000 to receive a full operating license
The city charges an annual $50 fee per allotted dockless vehicle
Plus a daily $1 fee per dockless vehicle
And $100 per designated group parking area
Louisville scooternomics, in sum:
A scooter generates $3.70 in revenue per ride
Deducting per-ride costs of charging, repairs, credit-card fees, customer support, and insurance, leaves $0.95 per ride
Multiplied by 3.49 rides per day is $3.32 in net revenue per scooter per day
Minus the city’s $1 daily fee leaves $2.32
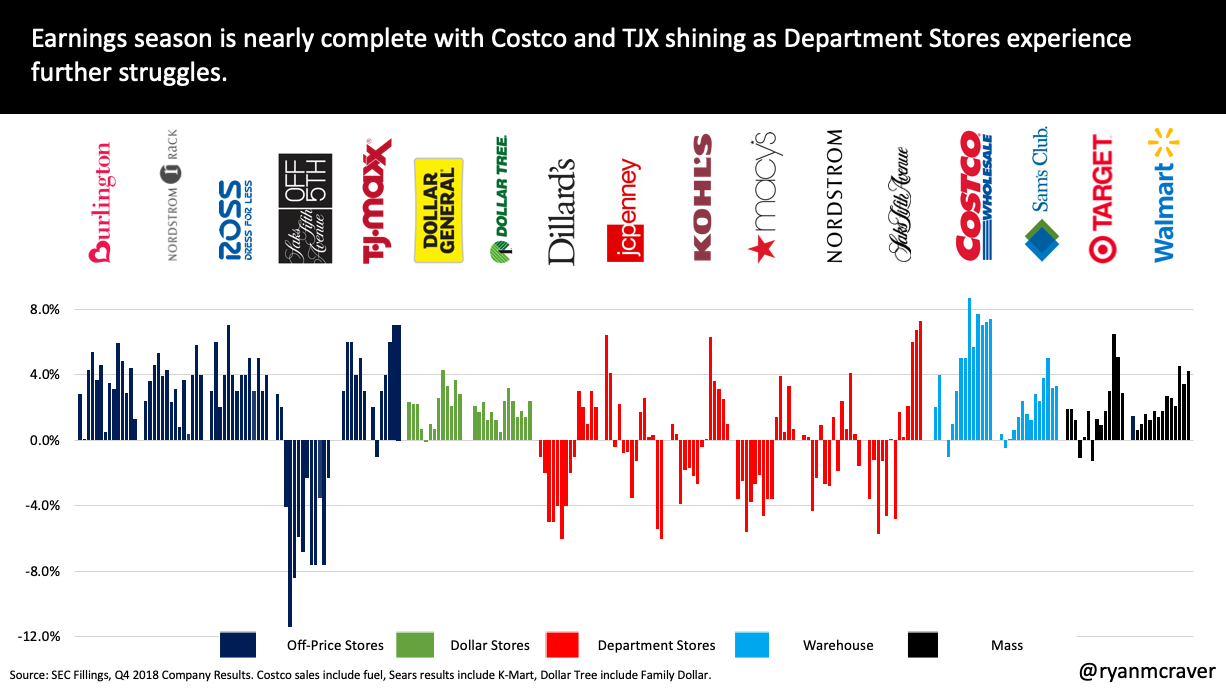
Retail Share Shifts Starting 2019: Costco & TJX
Comp sales released during earnings are a backward indicator of success in the preceding quarter but generally provide a view of how market share is shifting amongst like for like retailers as well as share leaving one sector to another. A couple of takeaways from this past quarter:
Costco is on fire. The warehouse club has posted 4 consecutive quarters of >7.0%. Phenomenal.
Off-price remains positive. All majors such as Burlington, Nordstrom Rack, Ross and TJX posted increases. Burlington was weakest amongst the majors and TJX posted a 3rd straight result >6.0%.
Big box mass sees above average results with Walmart posting an impressive 4.2% and Target just under 3.0%.
Department Stores remain difficult. From the abysmal results of JC Penney to the tepid results of Macy’s and Kohls.
I remain convinced that Costco still remains the best play in retail with their strong membership base moat and industry leading comp results. Second to Costco is TJX as they gain share from Department Stores and other retail bankruptcies.
Managing Email
Managing email and the pursuit of Inbox Zero is a daily battle. For some unknown reason, I am determined to always seek ways to make managing email more effective and efficient. Whether on Office 365, Google Apps or another mail provider, each of today’s apps have different functionality and use cases and none of them are perfect. Here are the latest apps I am using by device:
iPad/iPhone
Outlook - By far the best app I know of on iPad for email and provides. This has been my go-to since the days of Accompli (Microsoft acquired). Gmail doesn’t provide the individual email deletes in thread and really bugs me when filing that you can’t type in which folder in place of scrolling.
Laptop/Desktop (Browser or App)
Superhuman - Gmail on steroids. Keyboard shortcuts are more intuitive and wide ranging so you literally never touch the mouse. Search is faster, everything based in Chrome in place of another program and definitely the closest I have come to Inbox Zero. Three downsides: only available for Gmail/Google, partial calendar integration and iPhone app is quite slow.
What have I tried? Mail, Newton, Airmail, Gmail, Outlook Web, you name it. None are perfect but Outlook continues to hang and Superhuman is definitely onto something.
Roku Advertising Powers Higher
Roku recently released their earning and their results are quite impressive as they shift into an advertising platform built on TVs and through streaming sticks. Some of the highlights for Q4:
Platform revenue grew 77% year over year for the quarter to $151mm, a total of $416mm for the full year.
Streaming hours grew close to 70% year over year for the quarter to 7.3 billion hours.
The average revenue per user is now just under $18 with over 27 million active users (40% growth rate year over year for the quarter).
The idea of more targeted advertising to consumers that are paying better attention as cords continue to be cut continues to shine. Roku seems poised to benefit for the foreseeable future.
Ecommerce Needs Competition
eMarketer outlined where they believe the 2019 e-commerce market share will fall by end of year. The major gainer is expected to be Walmart with a growth of nearly 33% to $27.81 billion or 4.6% share (earlier today they announced a year over year growth of 40%). Even with that impressive number, there is no comparison to Amazon who is projected to grow 20% to $282.52 billion or an astounding 47.0% share. EBay meanwhile is number 2 with 6.1% market share but not truly growing.
Just look at the cliff in this bar chart to highlight the top 10 by market share. This continues each year and the gap only grows as the overall market grows faster and Amazon maintains its’ considerable lead.
Retail Online Sales Share (2019 via eMarketer)
I believe it is in the best interest of the e-commerce market to have at least two majors facing head to head followed by a long tail. That would at minium make this ecommerce race an oligopoly which not ideal but would be an improvement. With the current magnitude of separation continuing year over year and growing, I have become convinced the market needs a massive consolidation of market share to see a true competition and overall market health.
Given the list of retailers, there are a couple of options for tie-ups:
Walmart buying eBay - Extends their marketplace model with no further inventory needs.
Walmart buying Quarate (QVC, HSN, Zulily) - TV platform extension along with stable of brands to extend into stores and digital channels.
Walmart buying Wayfair - Fast growing home goods retailer with growing stable of sellers and advertising revenue.
Beyond the three tie-ups above, no other scenarios provide a meaningful increase in market share or are unlikely. Apple wouldn’t tie up with other retailers and I can’t imagine Costco growing outside their warehouse comfort zone. What say you?
Note: An eBay or Walmart could potentially acquire a platform provider like Farfetch or Shopify to roll up the market share of several brands but the general idea here would be roll up individual .coms or a handful of .coms.
Retail.coms Selling Ads
The sting of driving traffic to retailer .com sites through advertising via the Facebook and Google duopoly is expensive. The cost of shipping orders in the age of “free shipping” is even more expensive. So how else can retailers drive a higher revenue per visitor? Ads.
Each retailer knows the value of their traffic and understands the value of either selling the promotion of products on their site or linking out to other sites. Each retailer is taking one of two approaches: 1) self help advertising tools allowing any brand or seller to purchase keywords using budgets; 2) middle man large agencies providing limited access to keywords using budgets.
Amazon realized the value of ads early and built an extensive platform for brands to self administer their ads similar to Google. That business which is part of the “Other” category drove over $3b in revenue in Q4 2018.
Wayfair recently released their platform allowing brands and sellers to self administer their ads. Watch as the Wayfair narrative shifts from owned sales to services revenue (marketplace, advertising, etc.)
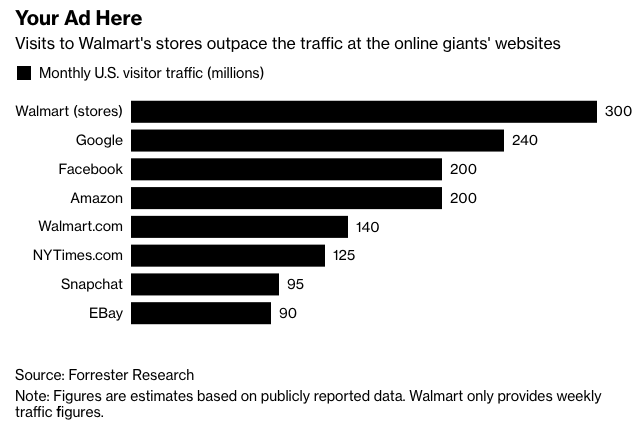
Whilst Amazon and Wayfair are focused on allowing anyone to gain access to spend on marketing, Walmart (who currently earning the most traffic of any retailer in the US) still sells the majority of their ads via large agencies such as Criteo. This is surprising as Walmart is focused on becoming more of a marketplace for small and medium size businesses yet is so restrictive on new accounts and access to marketing.
Traditional retailers that do not employ the marketplace model such Kohls, Target and Macys are even more guarded. These retailers ONLY allow marketing via large agencies and to those brands who sell them directly.
As this space continues to evolve, we will see more and more ads as brands realize there are very few sales earned via organic searches and retailers understand the value of captive customers and what a brand is willing to pay for a click.
Amazon Earnings Hot Take
As the Amazon earnings hit the news wire, the stock initially traded up after hours but after sifting through the nearly 20 pages, the forecast drove the stock lower. A few takeaways from the latest earnings release:
The overall revenue grew just under 20% which is a low for a number of years.
Q4 typically sees the lowest growth rates given the large base of retail sales in Q4 in North America.
North America sales saw one of weakest quarters in recent years. I believe this is likely due to Amazon adding in long term storage fees for 3rd party sellers that led to sellers pulling inventory and thus impacting sales. Amazon has since retracted those long term storage fees beginning February 15.
The International revenue was up 15% which is a slight uptick from the 13% posted last quarter. Given recent Indian restrictions being announced, the Q1 forecast is a bit cloudy.
The most profitable businesses continue to have the highest growth rates. AWS has now accounted for >10% of the revenue for the 4th consecutive quarter. The “Other” category that includes Advertising grew 90%+ year over year.
3rd party sales via the marketplace continue to gain share year over year as Amazon pullsback on 1st party owned sales.
Whole Foods/store sales saw a decline as the company calendarized their results and highlighted that any sales driven by Amazon and delivered fall into the online sales bucket.
Bottom line: Whilst the revenue growth numbers were disappointing, Amazon’s key offerings (AWS, Services and Other) continue to grow rapidly and are bringing much desired profitability.


Ride-Hailing App Stats
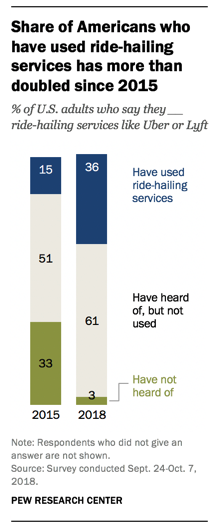
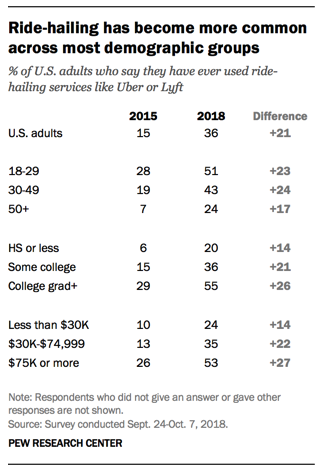
Pew recently outlined the dramatic rise of ride-hailing services such as Uber, Lyft, Juno, etc. There were a few stats that stuck out to me:
Only 3% of respondents hadn’t heard of ride-hailing services, this is down from 33% in 2015
36% of respondents have used ride-hailing, this is up from 15% in 2015
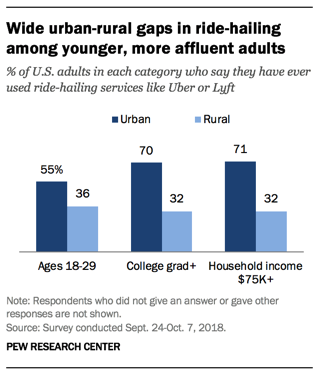
Within urban environments, >70% of college grads and high income households have used ride-hailing
The report doesn’t outline frequency of use but still impressive that awareness is nearly saturated across rural and urban locations and all age groups. Take a look at the full report screenshots below.
India Marketplace Smackdown
India recently launched legislation that has brought quite a bit of confusion but is clearly a setback for Amazon and Walmart (Flipkart stake):
“An entity having equity participation by e-commerce marketplace entity or its group companies, or having control on its inventory by e-commerce marketplace entity or its group companies, will not be permitted to sell its products on the platform run by such marketplace entity,” the commerce ministry said in a statement.
E-commerce companies can make bulk purchases through their wholesale units or other group companies that in turn sell the products to select sellers, such as their affiliates or other companies with which they have agreements.
The ruling implies that marketplaces such as Amazon and Flipkart will not be able to offer their own private label products or exclusive products on their respective platforms. All vendors will have to be provided the same terms and no vendor can be forced to exclusivity. I would assume Amazon and Flipkart will contest the ruling before the February 1, 2019 enforcement date.
Reading Into Amazon Seller Fee Changes
As often pointed out, greater than 50% of the product sold on Amazon is sold by small and medium size businesses around the world. In fact, it is estimated that more than 2 million sellers on the US marketplace are selling more than >$1 million in retail sales annually. These sellers use Amazon’s customers/traffic, logistics network and marketing capabilities to sell their product on Amazon each and every day. This type of business is incredibly lucrative for Amazon as they never take ownership of inventory.
Just yesterday Amazon made some changes to those fees charged to sellers that typically provide a viewpoint on the type of product Amazon is looking to attract or how their current businesses are performing. Here are my thoughts:
Storage Fees - Amazon surprised most sellers by eliminating the 6-12 month long term storage charges. This goes against their recent increase and monthly long term storage charge that began to charge monthly in Summer 2018. This leads me to believe that Amazon saw significant drops in inventory held by sellers that led to higher out of stocks and missed sales.
Referral Fees - Three years ago Amazon led everyone to believe they cared most about Apparel. In reality that was a massive head fake as Amazon eventually realized that everyone’s wallet is spent on grocery, health and beauty. You can see that is evident in Amazon dropping the referral fees in both categories. Additionally, they are dropping the referral fees in Jewelry for items over $250. This tells me they are trying to recruit less trinkets and trash and more high end jewelry.
Fulfillment Fees - Generally there were very little changes. Amazon did however simplify the Subscribe & Save fee structure showing their desire to build this business further.
Bottom line: All the above changes highlight Amazon doubling down on key categories like Grocery and Health along with an understanding that Sellers drive the overall marketplace with their consigned inventory.
Self Driving Is Here →
Who would’ve thought it would come so quick? Who would’ve thought it would come from Google before Uber or Lyft? Incredible.
“With little fanfare, the company has begun charging passengers to use its driverless vehicles in a roughly 100-mile (160 km) zone in four Phoenix suburbs - Chandler, Tempe, Mesa and Gilbert - where it has been testing its technology since 2016.
Waymo would not say exactly how many of its cars would be on the road in Arizona. It said its around-the-clock service initially would be limited to “hundreds” of people invited to sign up last year. For now, pricing is roughly in line with that of Uber and Lyft. A 15-minute, 3-mile (4.8 km) drive taken by Reuters last week cost $7.59, just above the $7.22 offered by Lyft.”
The Retail Home Stretch: Thanksgiving to Cyber Monday
Ask anyone and they will give you a different answer as to what Thanksgiving, Black Friday and Cyber Monday means for retail. Answers range from the day in which lowest prices are to be had to the week in which retailers become profitable for the year. Neither of which is true. Before Black Friday came to be, the Macy’s Thanksgiving Day parade started in 1924 which was actually inspired by Canadian store Eaton’s way back in 1905. Retailers had a gentlemen’s agreement to hold their holiday sales until the Friday after the parade. The term Black Friday didn’t become famous until 1966 when the Philadelphia Police coined the term to describe the traffic jams and crowds in downtown stores.
Fast forward to today and the public largely views the Thursday to Monday as indication of the health of consumer spending and the economy. The Black Friday of 2018 has been labeled a calm, cool, collect and weak showing. So much so, some have labeled the death of Black Friday. We won’t know the truth until we see the full Q4 earnings from retailers but what we do know is…
Traffic per ShopperTrak was down approximately 1.0% to stores and specifically down 1.7% on Black Friday. This is versus the 1.6% they were down last year.
As for ecommerce, sales have been up >22% on Thanksgiving, Black Friday and Saturday thus far. In fact, the growth of 2018 exceeded that of 2016 to 2017 on each of the three days. Given the strength, I would expect Sunday and Cyber Monday to come in above expectations.
UPDATE: Sunday came in well ahead of expectations and grew 25% year over year.
Bottom Line: Black Friday isn’t dead, it has just shifted. The consumer is strong for now and this continues to illustrate the continued shift to ecommerce.
Headed into Black Friday...
With Black Friday upon us, I thought it would be worthwhile to provide a bit of context on what I believe we are seeing in retail with the latest quarterly earnings:
In general, retailers are posting strong results on a sales basis versus what we have seen in previous years. Low unemployment, generally positive consumer sentiment and wage growth are likely the major contributors. Specific niches of retail are seeing a shift of sales from bankruptcies and store closures which has also been accretive. With all of that said, I still believe most retailers still require further store grooming through closures and will face more difficult margins in the years ahead due to the growth of ecommerce.
Target - Strong year over year comp of 5.1% which was down from 6.5% in Q2 (best in 13 years). Of all the retailers, the year over year improvements is most evident in Target. Last year’s comps in Q2 and Q3 were 1.3% and 0.9% respectively. Looking ahead, Target guided a sales comp for Q4 of 5.0%
Walmart - The juggernaut reported a strong Q3 comp of 3.4% with ecommerce growing 43%. With Walmart coming off a 4.5% comp in Q2 (best in 10 years) and muted forward guidance of at least a 3% comp in Q4, investors weren’t that pleased. Walmart’s stake in JD.com also hasn’t helped with the CEO stepping down and some weaker than expected profitability and cloudy outlook. Lastly, the warehouse club arm, Sam’s Club posted a 3.2% comp which was down from 5.0% in Q2. I don’t see anything particularly alarming just believe the stock price got ahead of itself and Walmart’s ability to grow ecommerce share in the US is still a concern especially as the profitability remains difficult.
JC Penney - Disastrous quarter for this retailer who had posted four consecutive positive quarters prior to the -5.4% Q3 comp. I still see plenty of pain ahead marking this chain as the next “on watch” retailer.
Kohls - Another strong year over year comp but deceleration has set in with a Q3 comp of 2.5% versus >3% in previous quarters and 6.3% in Q4. I still find this to be the best mid-tier department store when you compare Kohls to the likes of Dillards, JC Penney and Macys.
Macy’s - 2nd best comp over past several years with a 3.3%. Management was especially rosy on the call about Q4 but only provided slight increases to the low end comp guidance of 2.3%. Ecommerce is firing with additional product added to site and extensive use of buy online, pick-up in store. Macy's is definitely benefiting from a strong consumer but also seeing margin pressure from ecommerce.
Nordstrom - Full line continues to struggle despite last quarter’s pop of 4.1%, their upper end offering posted a measly 0.4%. Their off price offering Rack on the other hand continues to perform well with a 5.8% comp. Nordstrom’s total online business now accounts for 30% of their sales, highest of all the retailers compared here.
TJ Maxx - Both the home offering and main line offering continue to outperform the overall off price sector with a 7.0% comp in Q3.
Ross - A respectable 3.0% comp but TJ Maxx continues to shine and take market share as inventories at Ross have struggled.
Costco - This warehouse chain is on fire, posting nothing lower than a 7.0% comp this year. Q3 was 7.2% and Costco is just starting to tee up their ecommerce offering. With the moat of memberships, this retailer looks poised to continue their assault on retail market share.
Resurgent Retail?
Recent headlines in retail have shifted the narrative from retail is dead to retail is strong and alive. Some headlines over the last few weeks included:
- Walmart posts the best store comp in 10 years
- Target posts the best comp in 13 years
- Macy's return to a positive store comp and increases annual guidance
While this is all great news for retail, be reminded that high tides lift all boats. Wages are growing at the fastest rate in 9 years and unemployment remains below 4%. The stock market continues to rally in the longest recorded bull market in history. Restaurants continue to see strong sales year over year and even amusement parks are posting their best months. Consumers are spending everywhere and providing much needed relief.
Bottom line: This is shaping up to be a rosy holiday period for retail. With that said, positive sales hide a lot of sins. Enjoy the party now, but the long term trends of shifting to online in an "overstored" environment will still be here when the champagne runs out.
Amazon: "Pay to Play" Search
In 2017, one of the key lines you would read, hear or see related to Amazon was how Amazon product searches outnumbered those of Google. Although this has become well known, Jumpshot recently revealed that 90% of pageviews come from the search box:
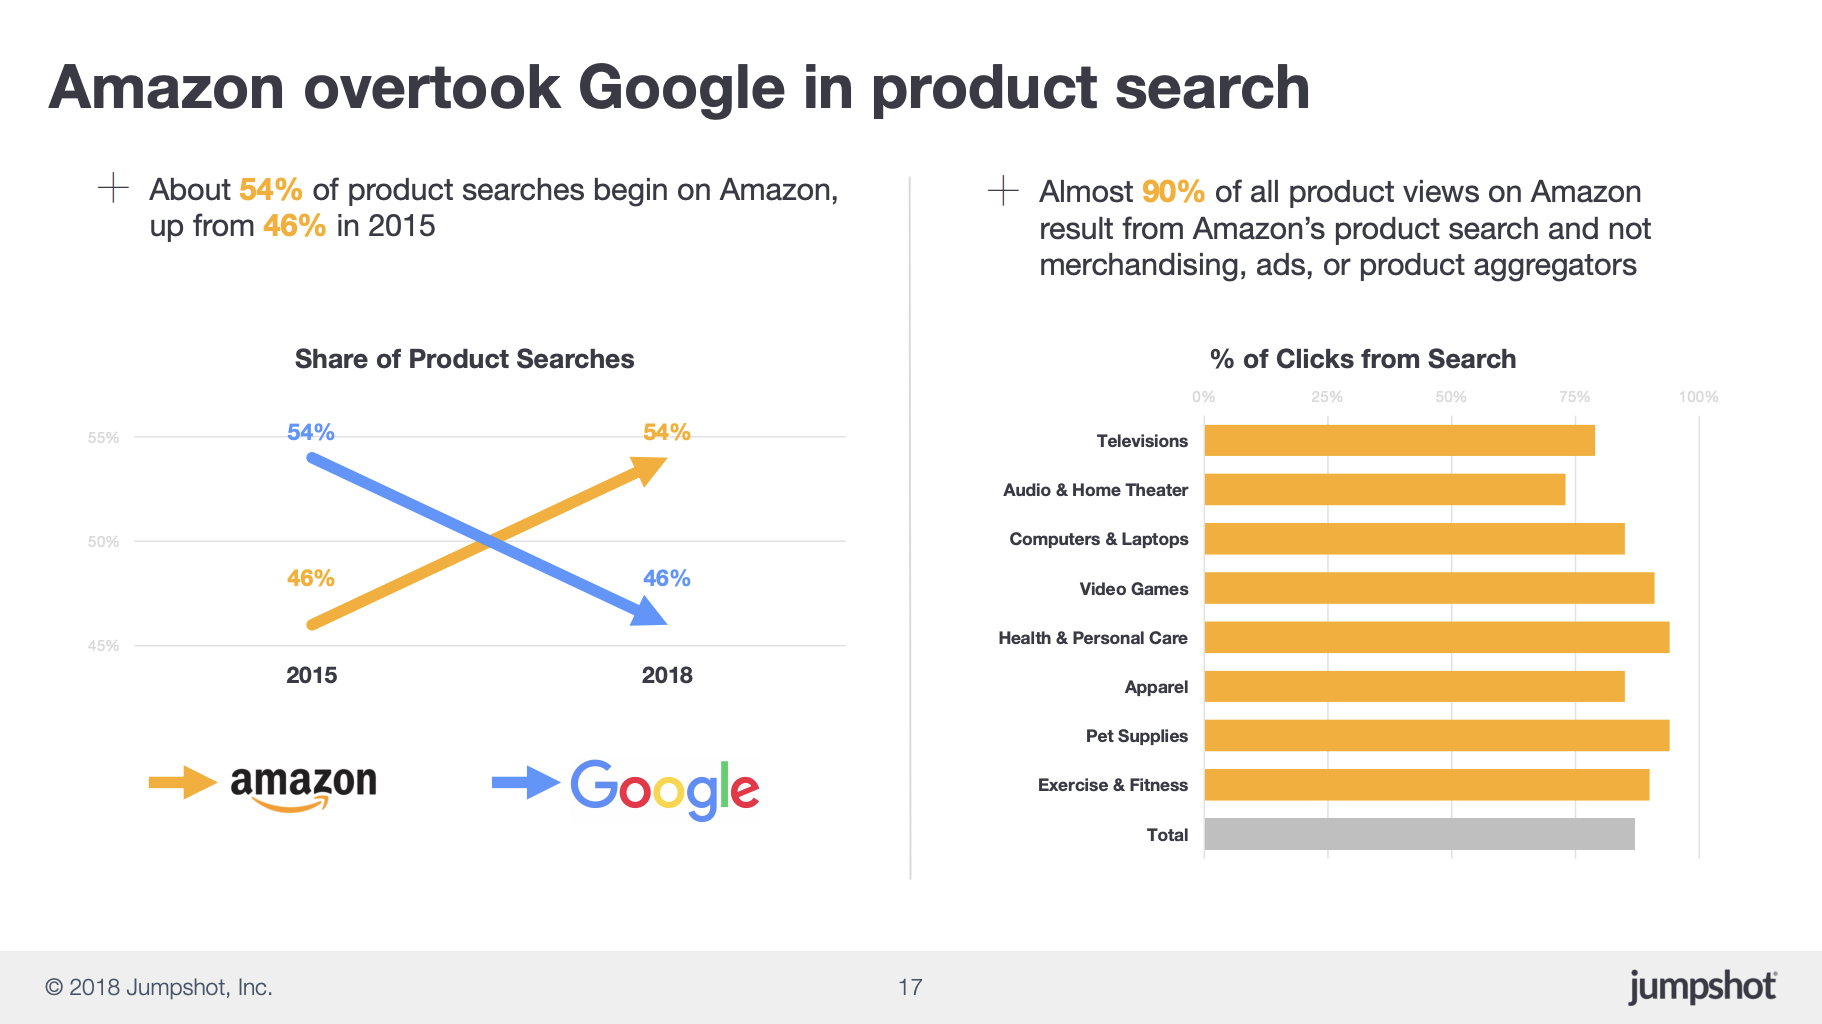
And within the search results, the first row on the first page of search drives 20% of page views:
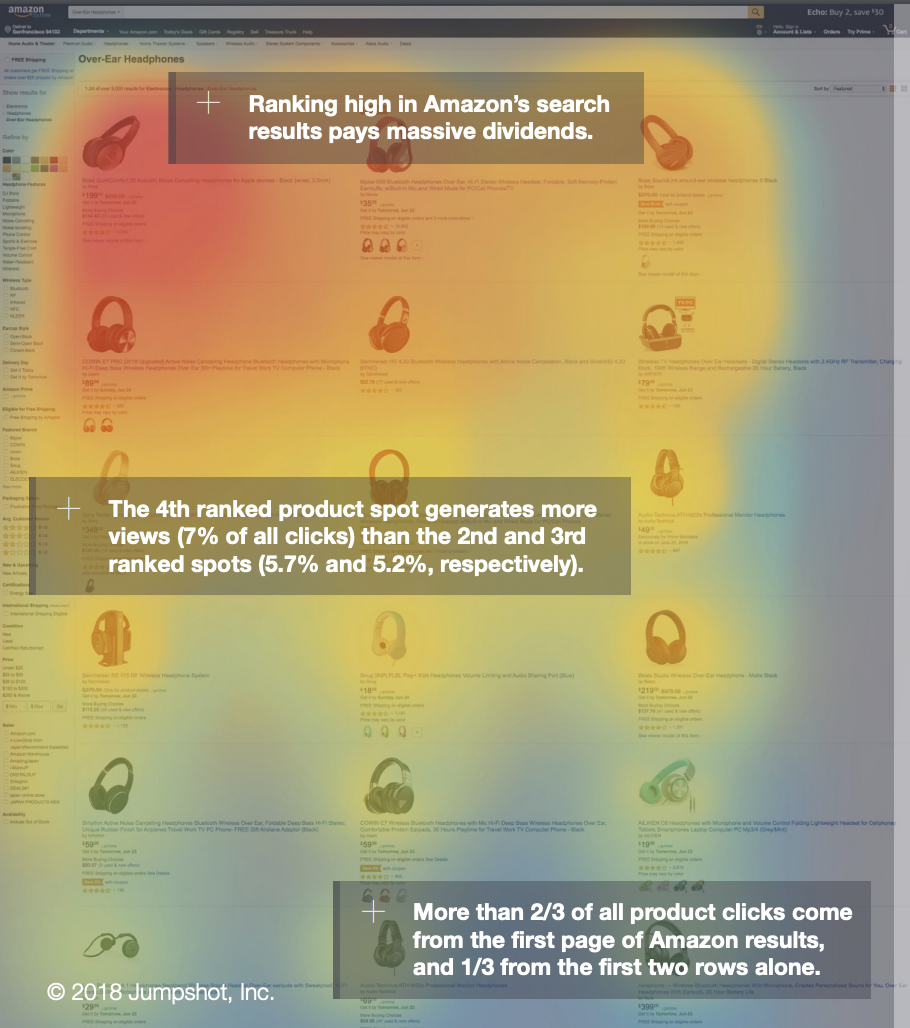
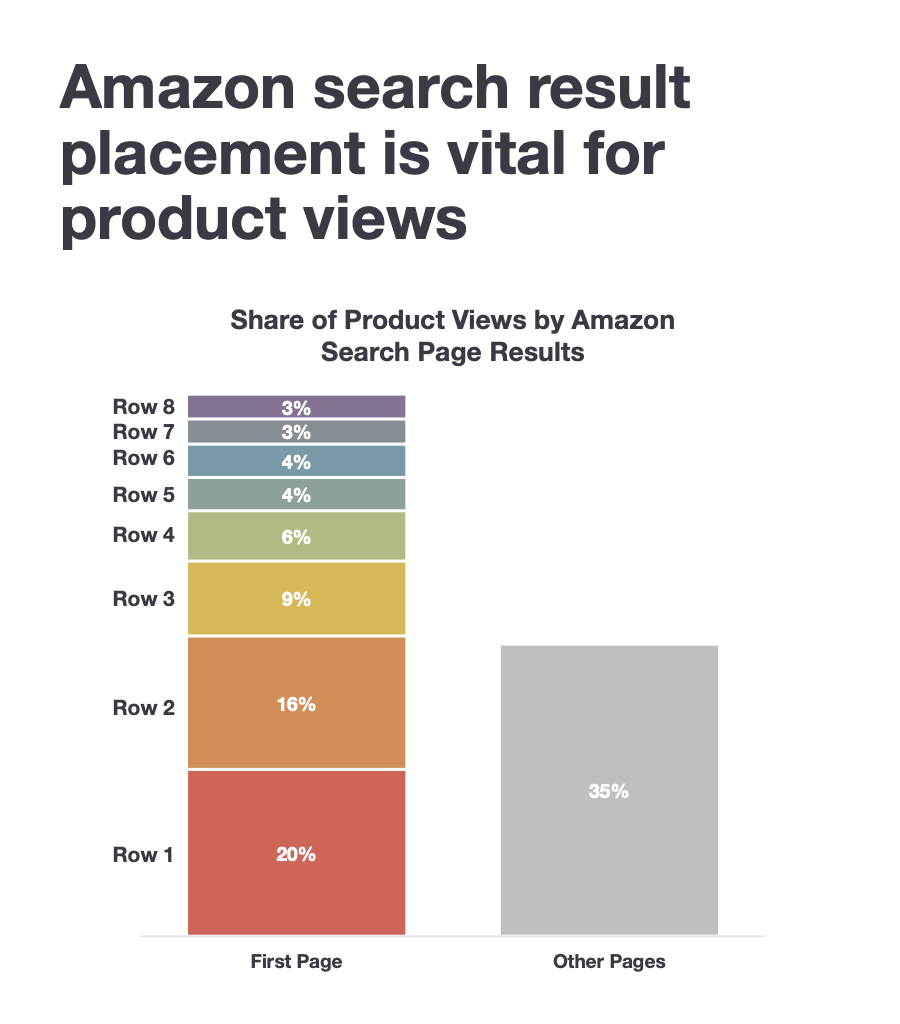
The marketplace is becoming increasingly a "pay to play" marketplace where the page views are increasingly being driven from keyword buys:
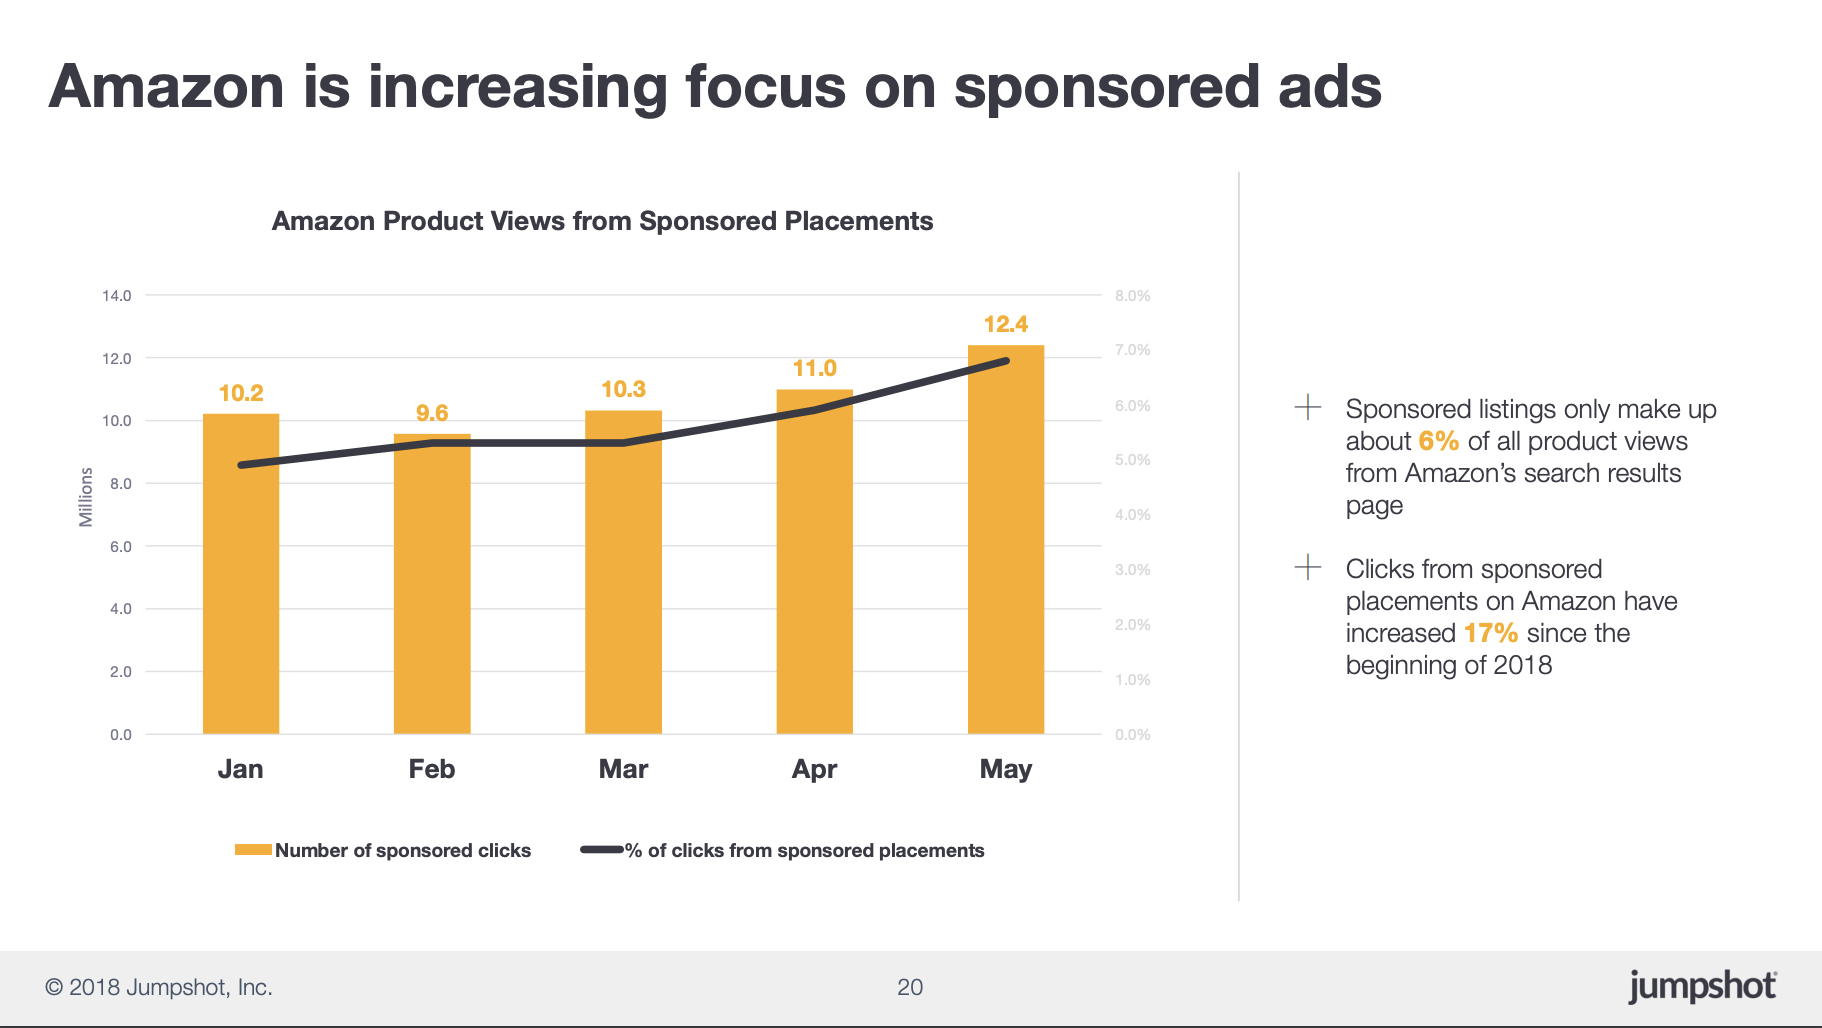
Bottom Line: Amazon has the lion share of ecommerce growth captive, now it's all about extracting more services revenue from that base. Amazon's shift to "pay to play" is far from over.
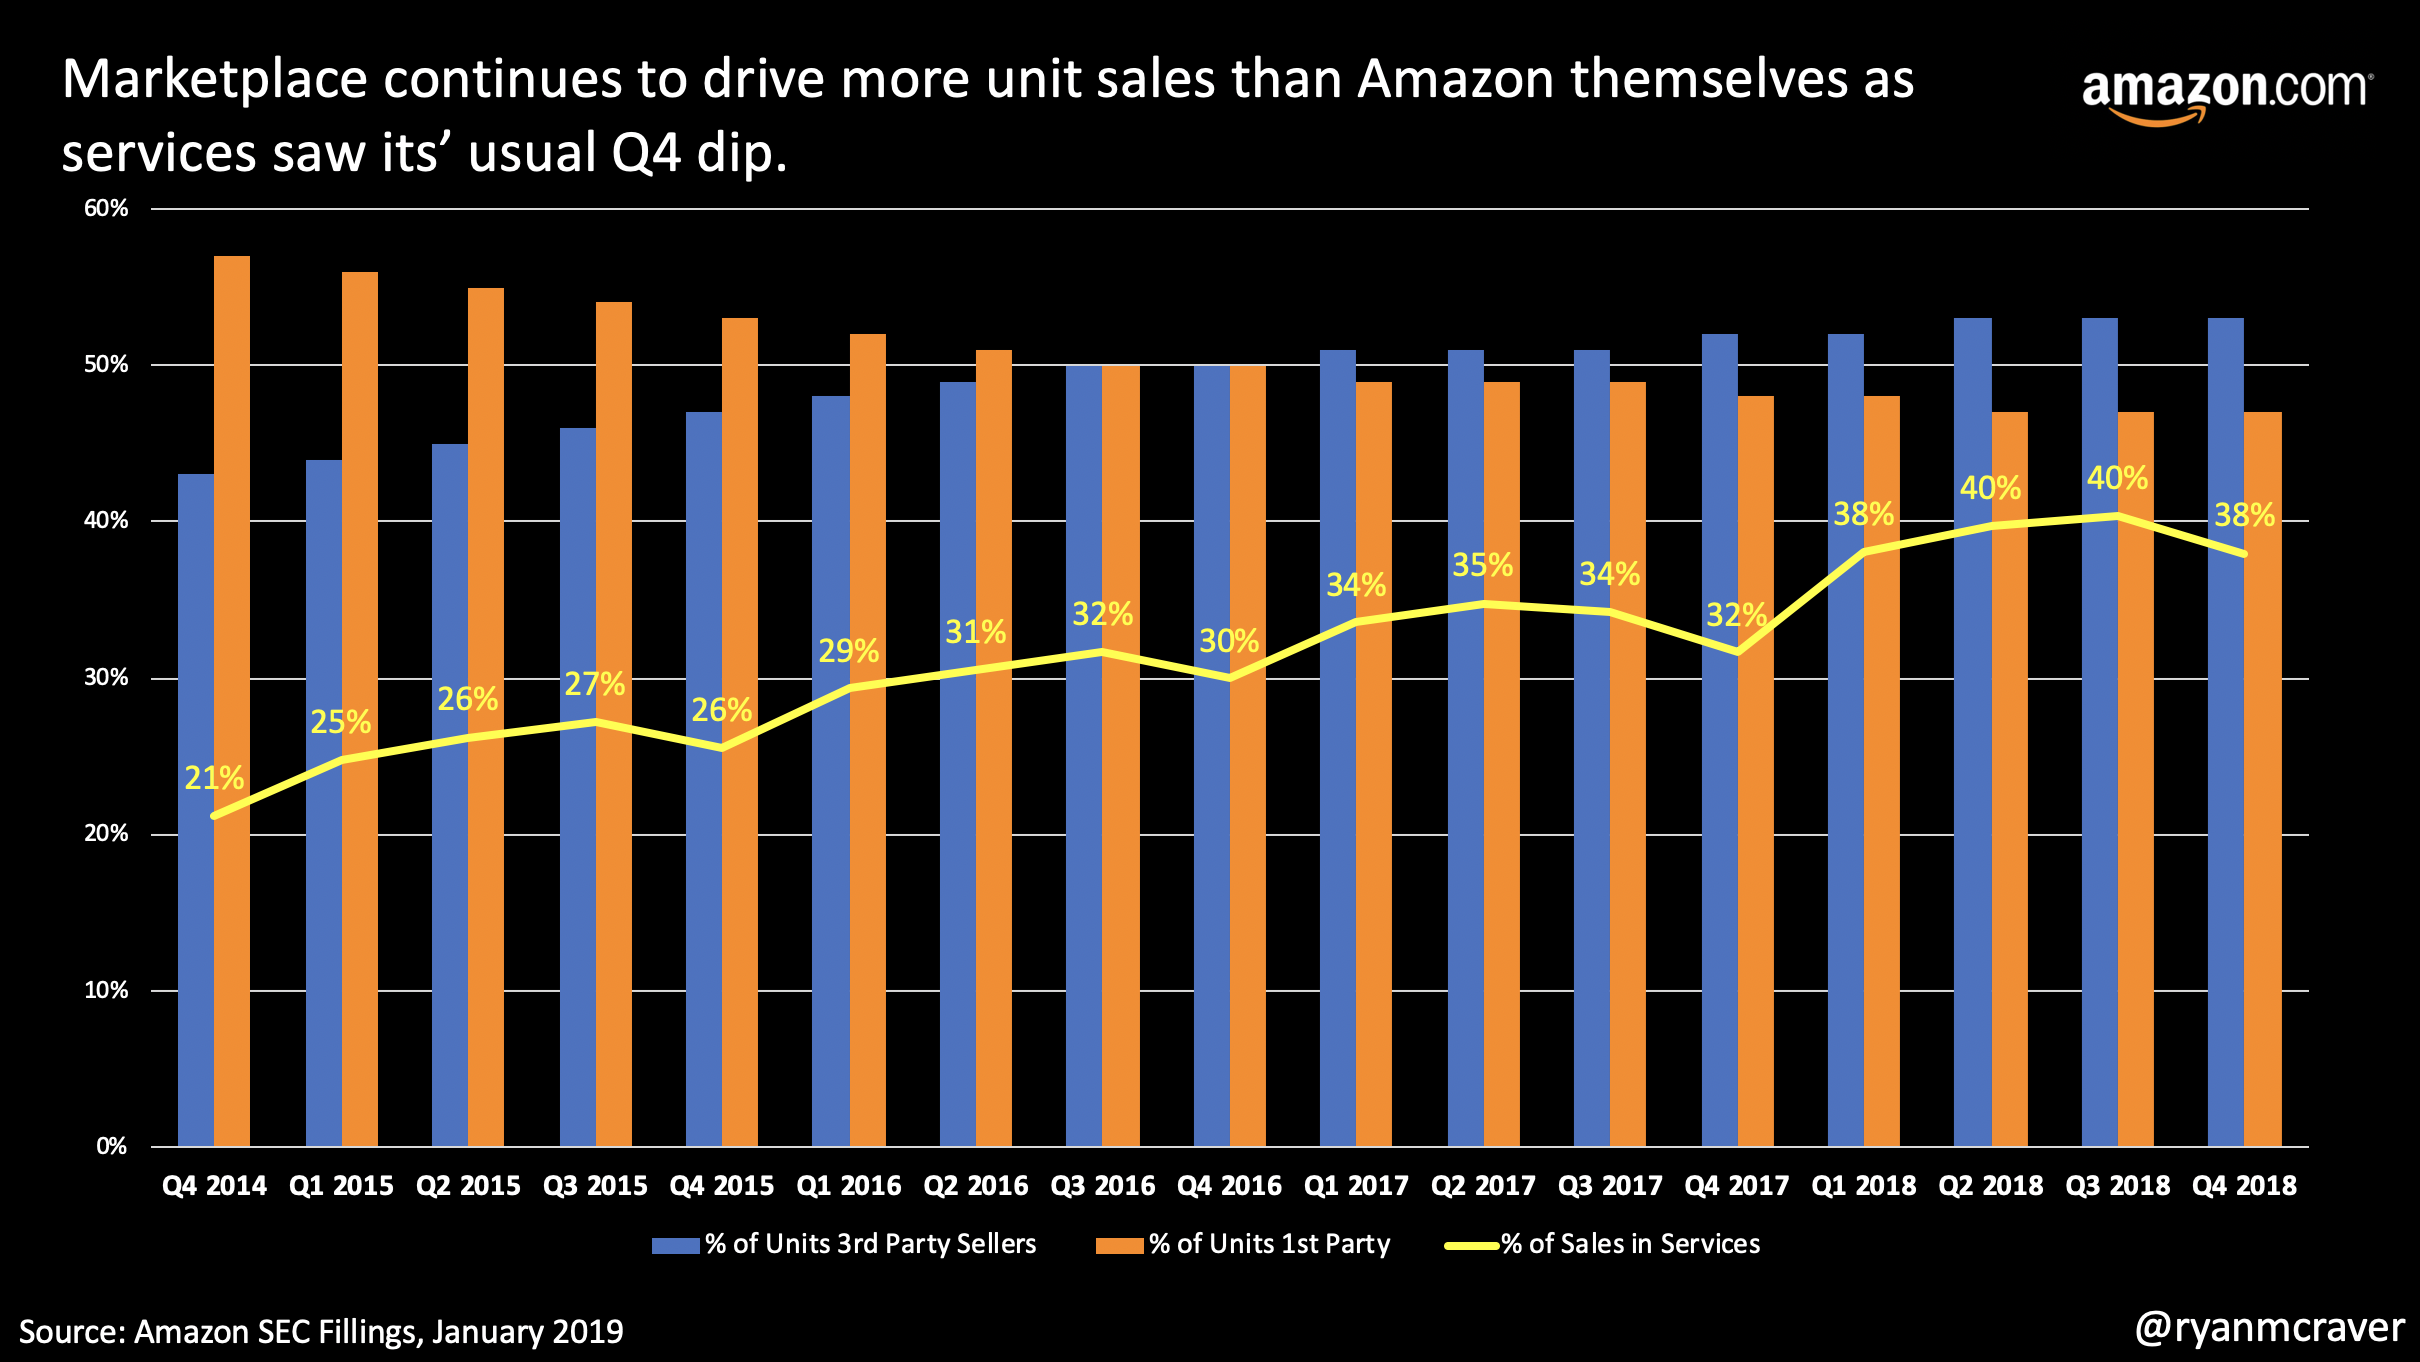
Amazon Earnings In Pictures
Another blockbuster quarter for Amazon with a few key takeaways:
Services revenue continues to grow at astounding rates and now account for 40% of overall revenue (up from 34% in last year's quarter)
AWS continues to grow at rates of 40%+ and international slowed a bit from previous quarter growth rates
Whole Foods is impacting store revenues. Online accounted for 51% versus 63% in the previous year's quarter
